
Air quality affects breathability and general quality of life, with good quality air supporting healthy lifestyles. On the flip side, poor air quality triggers medical conditions and diseases. In fact, most respiratory challenges have a link to poor air quality.
With this in mind, it is easy to appreciate the significance of air quality in any state. Unfortunately, Tennessee ranks as one of the 10 states with the worst air quality in the U.S. The cause is rampant pollution rates. After all, states with the highest rates of air pollution suffer from the worst air quality.
Approximately 40% of the U.S. population resides in polluted areas. While a bigger percentage of the U.S. still enjoys fine air quality, 40% is a large segment of the population and cannot be ignored!
Definition of Air Quality
The best way to define air quality is a measure or quantification that depicts air cleanliness.
The Air Quality Index (AQI) helps to depict this measure. The AQI measure ranges from 0-500. This is how we quantify and rank different states, cities, and towns based on air quality.
The quality of air is majorly affected by pollution agents. The biggest culprits are:
- Aerosols
- Carbon monoxide
- Nitrogen dioxide
- Sulfur dioxide
- Ground-level ozone
- Airborne particles
Some of these pollutants are more dangerous than others. They may occur at varying levels in different regions, thus affecting the air quality. Unfortunately, the effect of the pollutants and deteriorating air quality worsens respiratory disease. Conditions such as asthma can worsen and become life-threatening.
Other negative health implications linked to poor air quality include stroke, cancer, and heart conditions.
It is important to interpret the measures of AQI correctly. This way, you can determine a region’s air quality level. Each range depicts different levels of risk.
- 0-50: Signifies little to no risk. The air quality is good.
- 51-100: Signifies moderate risk, especially to sensitive individuals. Air quality here is moderately fair.
- 10-150: Signifies unhealthy air quality levels for sensitive individuals.
- 151-200: This signifies unhealthy air quality to the whole population, with partial risk to healthy individuals and high risk to sensitive people.
- 201-300: This is very unhealthy. The health risks can be very damaging to the general population.
- 301-500: This is a hazardous level. The general public is at risk of serious health implications.
State of Air Quality in Tennessee
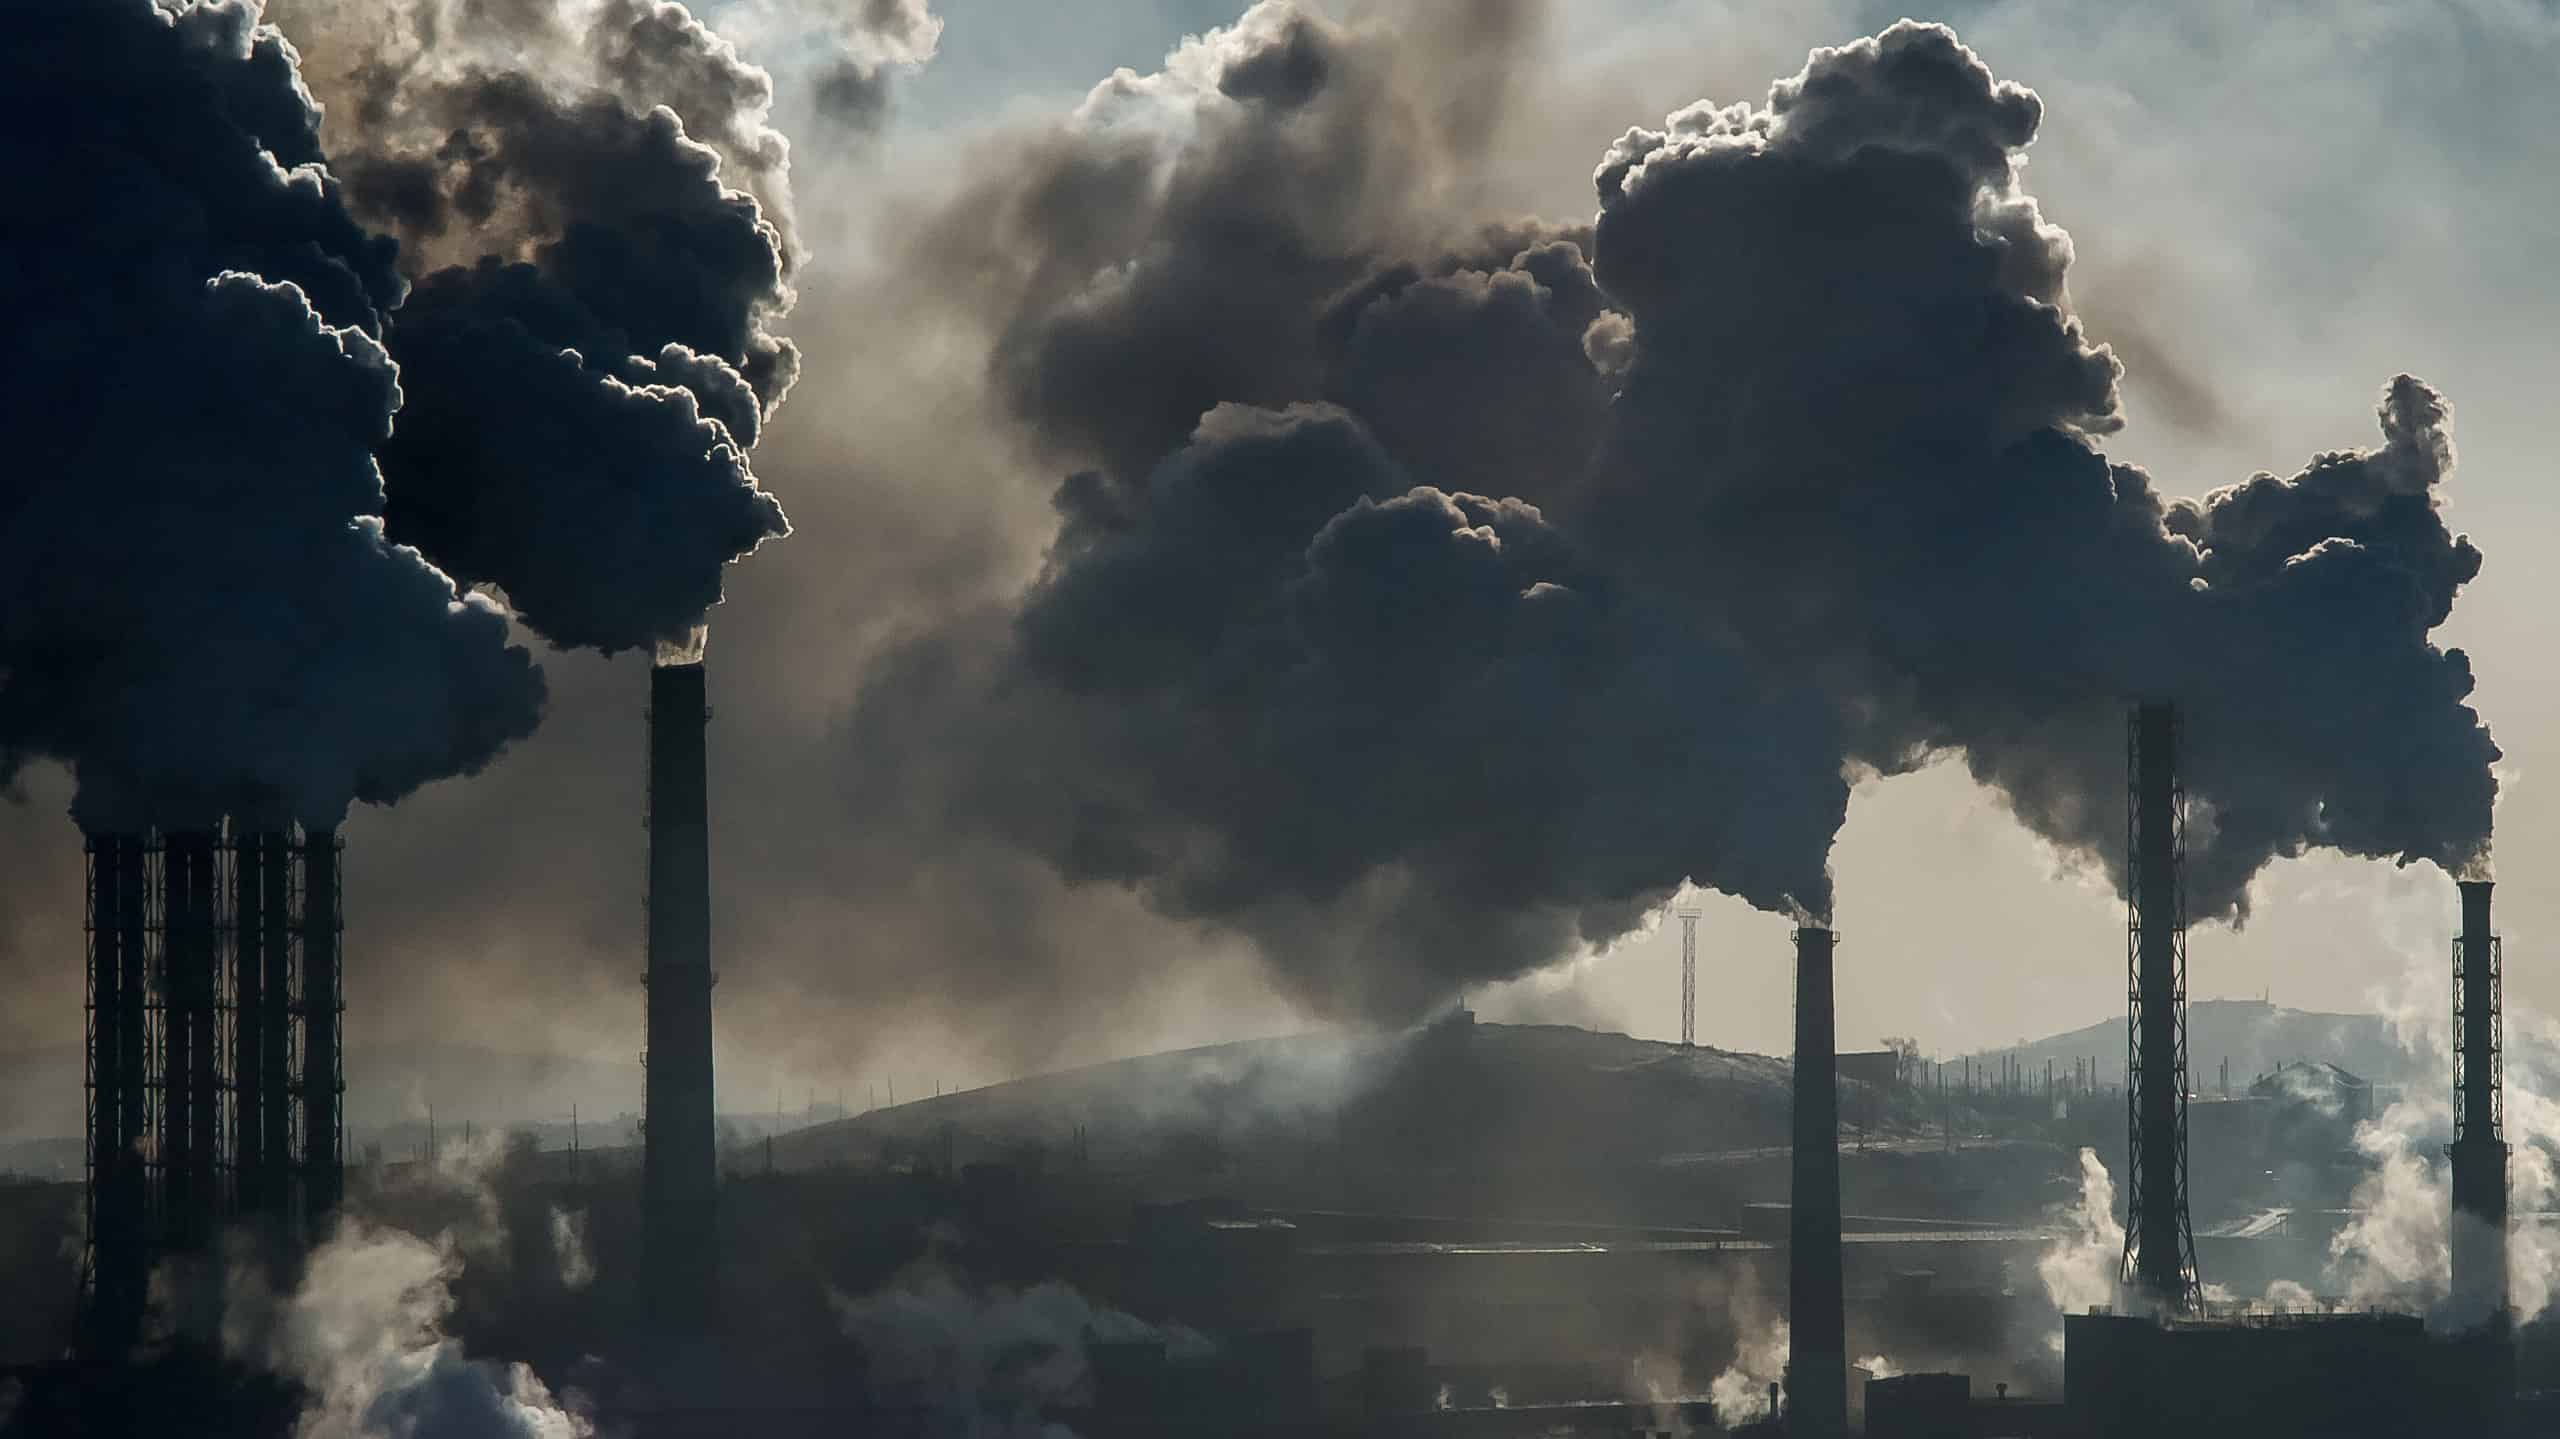
Harmful gases and pollutants in the air deteriorate the air quality.
©nEwyyy/Shutterstock.com
This state ranks among the top 10 U.S. states with the worst air quality. The state has an AQI rate of 47.5.
Red Bank has the worst air quality in Tennessee. Relevant authorities are taking measures to ensure a reversal of pollution status.
The main cause of pollution is industrial combustion and vehicle emissions. Most auto traffic on Tennessee roads is due to large diesel trucks carrying marble, gravel, and sand to other regions of the country. Consequently, the state witnesses more pollution from this kind of fuel combustion. In fact, the average rate in this state is higher than in others.
Fossil fuel and truck rubber particles also contribute to pollution in Tennessee. These may come from factories, construction sites, forest fires, mining sites, and power manufacturing plants.
The Rate of Pollution/Air Quality in Tennessee
Tennessee is located in the southeastern portion of the country. It borders eight other states and is the 16th most populated state in the U.S. The state is home to over 6.9 million people and countless wildlife.
The state also hosts several industries, which explains the air quality degradation. In a recent rating, most of the cities in Tennessee performed dismally on air quality. Many of them had a rating of PM2.5, which is relatively high and signals the need of improvements. The rating indicates the particulate matter. In this case, it is 2.5 micrometers in diameter or less.
Red Bank, TN, registered a PM2.5 reading of 12.2 μg/m³ as the average in 2020. This classification falls under the moderate rating in pollution rankings. This score places Red Bank as the most polluted city in the state and the 1808th globally. By U.S standards, this ranking is quite high. The authorities in the region need to prioritize measures that reduce pollution.
Fortunately, Red Bank seems to be the state’s only city with moderate pollution rankings. Three other cities put to the test ranked well. They fell under the 10 μg/m³ or less bracket, which is excellent. However, this does not exempt Tennessee from taking action — certain areas in the state are hot zones.
Possible Causes of Air Pollution in Tennessee
Tennessee is prone to many pollutants. The sources of pollution in this state vary from anthropogenic to meteorological. But natural causes of pollution are very minimal.
Almost all pollution causes are traceable to combustion sites. One of the most prominent pollution causes is vehicle combustion. While the problem is not localized to Tennessee, it is more problematic in this southeastern state. This is due to the large number of huge trucks. Mineral extraction activities and goods transportation are both major reasons for pollution. Factories are also known to contribute to the pollution rate.
What Period is the Air Quality in Tennessee at Its Worst?
From the trends observed in the 2020 investigation, timing is important. There are times when pollution is at its worst level. The PM2.5 level seemed to go up in the later months of 2020.
However, the ratings were sporadic in the most polluted cities, such as Red Bank. They were not specific to any month of the year. For example, the city of Memphis experienced its highest rate of pollution in the middle of the year.
This was best captured in the findings of the different cities below:
- Red bank – 16.1 μg/m³
- Goodlettsville – 14.7 μg/m³
- Chattanooga -14.8 μg/m³
- Farragut – 14.5 μg/m³
- Hendersonville – 17.1 μg/m³
- Knoxville – 21.9 μg/m³
Who is Affected by High Pollution Rate in Tennessee?
Unfortunately, the effects of pollution affect everyone in the population. There is no sure way to protect oneself from the effects of such poor air quality.
People
The greatest part of the population affected by this exposure is young children, the elderly, pregnant mothers, and people with compromised immunity. People who are sedentary and smokers are also prone to higher risks. Other affected individuals include those who are hypersensitive to chemicals. Allergies and sensitivities may develop due to exposure to chemicals and contaminants.
Nature
Unfortunately, pollution and poor air quality not only affect humans. The effects are also felt by the ecosystem as a whole.
Generally, air pollution tends to damage plants, stress the soil, and obscures scenic views. Due to nitrogen overload, forests experience acidic rains, causing damage to the vegetation. The deposits of nitrogen and sulfur affect the ecosystem of the forests. Some of the compounds get washed downstream, where they are consumed by animals, negatively impacting them. In fact, degradation of natural resources due to poor air quality affects the entire food chain.
Animals
Animals are often affected, especially in the case of wildfires. Their health tends to deteriorate due to smoke, as they suffer from particles that affect their respiratory wellness. Some animals die due to overexposure to pollutants and poor air quality. This could lead to the extinction of some unique animals only found in this region.
Cleanest Cities in Tennessee
On the flip side, Tennessee has a few clean cities. People with high sensitivities should consider making these cities their homes. These cities include:
- Athens – AQI O
- Bristol – AQI 4
- Louisville – AQI 8
- Kingsport – AQI 12
- Harriman – AQI 13
- Knoxville – AQI 16
- Gatlinburg – AQI20
- Sevierville – AQI20
- Maryville – AQI21
- Loudon – AQI23
Types of Pollution in Tennessee
The most common types of pollution in the state are:
- Carbon monoxide
- Carbon dioxide
- Sulfur dioxide
- Nitrogen dioxide
These gasses are notorious for polluting the environment. The consequences of these emissions are negative human and environmental impacts.
The significance of air quality must be a priority. However, maintaining clean air takes time and resources. But efforts are well worth the result. Reduced pollution rates guarantee both human and wildlife protection.
Where is Tennessee Located on a Map?
Here is Tennessee on a map:


How to Add Us to Google News


Thank you for reading! Have some feedback for us? Contact the AZ Animals editorial team.