
Founded on change, growth, and sometimes transformation, the United States is a dynamic and diverse country. Each of its states boasts its own unique character and identity. Most, if not all, sit on the brink of shifts in population and economic activity in the coming years. Here, we explore the 10 largest states today, the metrics used to assess their size, and what are likely to be the biggest states in 50 years.
The 10 Largest States Today
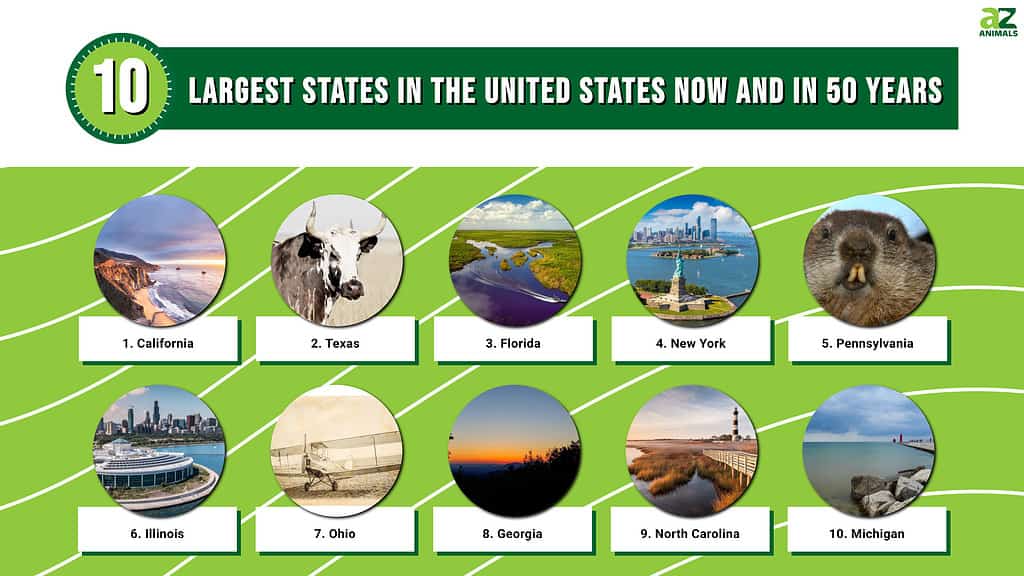
With over 333 million residents, the United States is currently the third most populous country in the world, behind India and China. We’ve compiled a list of the 10 largest states based on population and economic contributions, such as Gross Domestic Product, or GDP (for those interested in the largest by land area, we got you covered here):
1. California
The Golden State includes over 39 million people and has a GDP just shy of $3.6 trillion. Despite being one of 50 states (that’s 2%), it represents more than 14% of the US economy. If the Golden State was a Golden Country, it would be the fifth largest in the world, just below Germany and just above India. It’s a colorful blend of cultures, with a significant proportion of the population comprising Hispanics/Latinos (40.2%) and Asian Americans (15.9%).
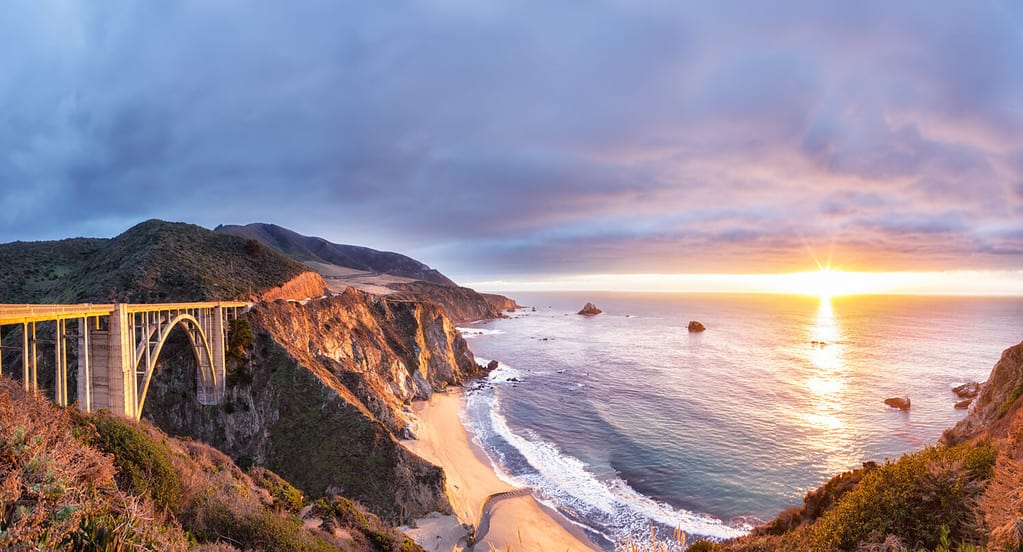
California is home to Highway 1, the longest scenic stretch of undeveloped coastline in the US.
©Zhukova Valentyna/Shutterstock.com
2. Texas
The Lone Star State hosts a population exceeding 30 million and a GDP of $2.1 trillion. Yes, things tend to be bigger in Texas. Demographic makeup is predominantly White (77.9%) and includes a large minority of Hispanics/Latinos (40.2%), as well as a significant African American population (13.2%).

The Texas Longhorn is appropriately named, as it’s the state animal.
©Wirestock Creators/Shutterstock.com
3. Florida
Along with crazy summertime humidity, the Sunshine State’s 22 million residents bask in a GDP of $1.4 trillion. Recognized for its significant Hispanic/Latino population (26.8%) and diverse demographic composition, the state is expected to continue its growth.
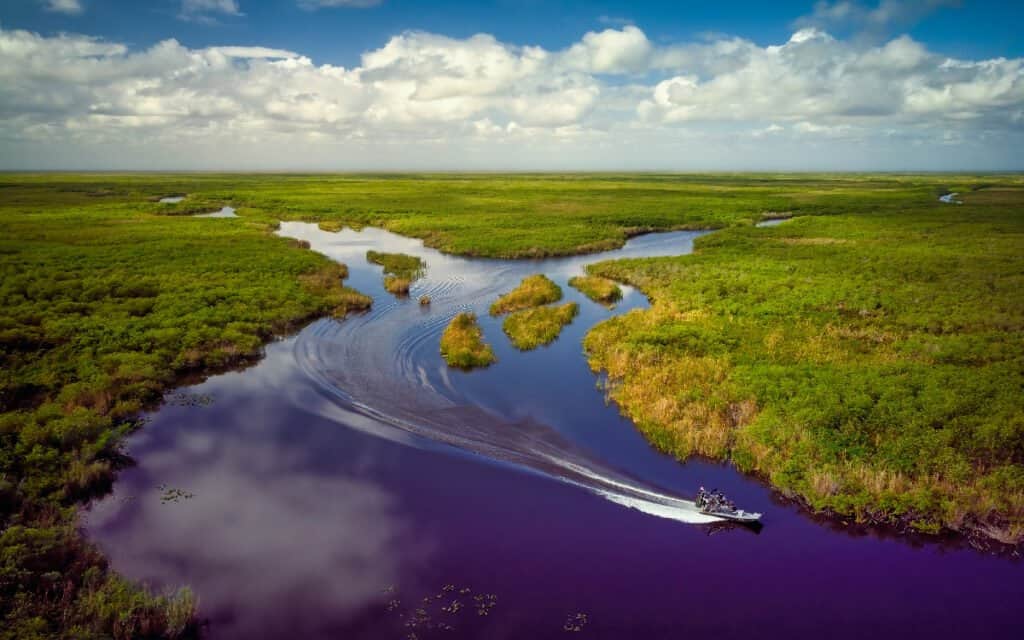
Everglades National Park in Florida contains one of the largest wetlands in the world.
©iStock.com/Robert DelVecchio – OcuDrone
4. New York
With a GDP of $2 trillion, the Empire State is home to nearly 20 million residents (excluding NYC’s infamous rats). A diverse population calls New York home, including Whites (69.1%), Hispanics/Latinos (19.5%), African Americans (17.6%), and Asians (9.3%).
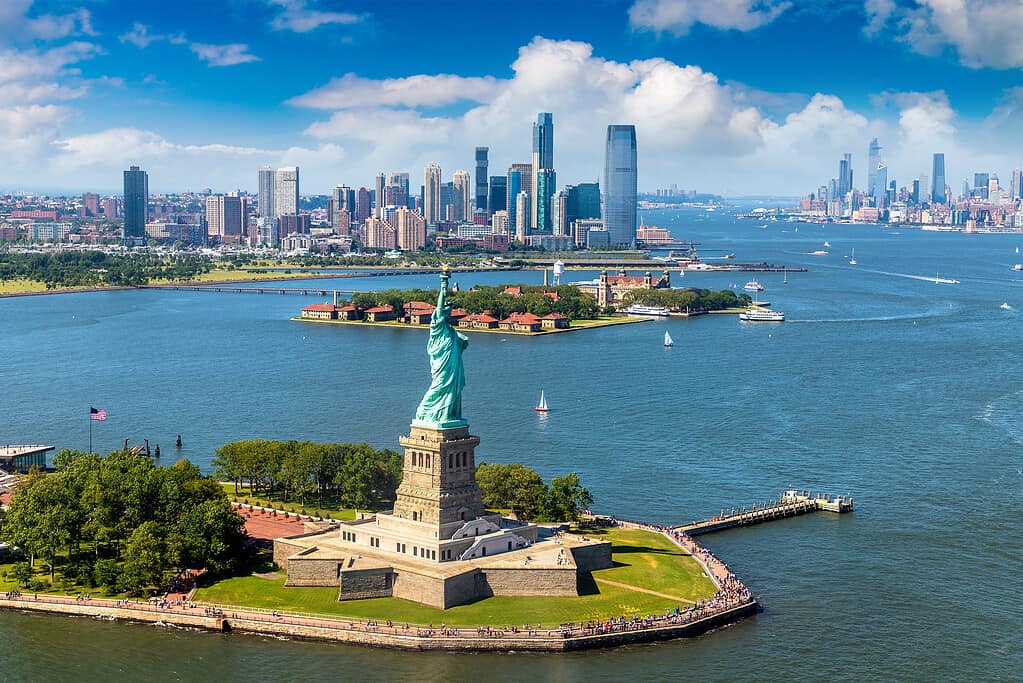
New York is home to one of the most iconic statues in the world, the Statue of Liberty.
©iStock.com/bloodua
5. Pennsylvania
The Keystone State, with nearly 13 million residents, is predominantly White (74.8%), with African Americans, Hispanics/Latinos, and Asians contributing to the state’s diversity. Its GDP sits at around $923 billion.

Pennsylvania’s most recognizable resident isn’t even human; rather, he’s a prognosticating groundhog named Punxsutawney Phil.
©Alan Freed/Shutterstock.com
6. Illinois
The Prairie State boasts a GDP of a little over $1 trillion. Totaling more than 12.5 million people, the state hosts a diverse population, with Whites, Hispanics/Latinos, African Americans, and Asians being the major ethnic groups.
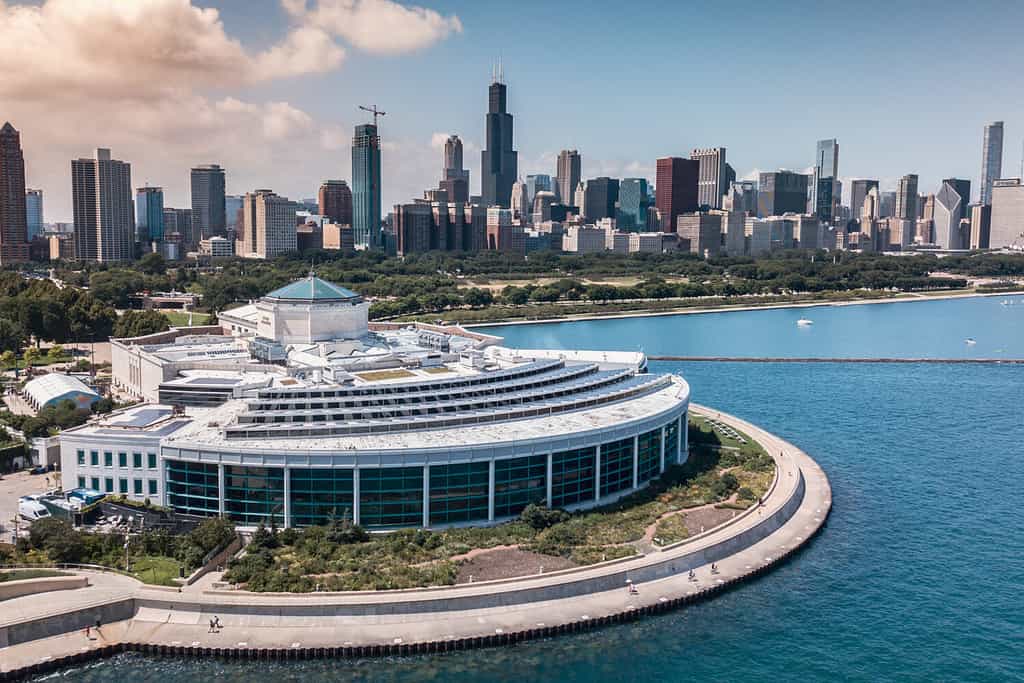
The Shedd Aquarium in Chicago, Illinois, cares for more than 32,000 animals.
©Robert Sarnowski/Shutterstock.com
7. Ohio
Like Illinois, the Buckeye State, with over 11.7 million residents, is predominantly White, with significant African American, Hispanic/Latino, and Asian populations. GDP sits at around $823 billion.

Ohio is known as the “Birthplace of Aviation,” since it was where the Wright Brothers came from and where they developed their airplane. (Though North Carolina accurately claims to be “First in Flight.”)
©rvbox/iStock via Getty Images
8. Georgia
With nearly 11 million residents, the Peach State hosts a large African-American population, along with White, Hispanic/Latino, and Asian communities. GDP is around $756 billion.

Springer Mountain, in Fannin County, Georgia, hosts the southern terminus of the Appalachian Trail.
©Beach Creatives/Shutterstock.com
9. North Carolina
Like Georgia, the Tar Heel State, with over 10.6 million residents, is predominantly White, with significant African-American, Hispanic, and Asian communities. GDP sits at around $730 billion.

North Carolina has the dubious distinction of being the only state that pirate Blackbeard for a period called home.
©MarkVanDykePhotography/Shutterstock.com
10. Michigan
The only state named after a Great Lake, Michigan (the Great Lakes State) hosts a population of over 10 million. It’s predominantly White, with African Americans, Hispanics, and Asians also contributing to the state’s diversity. GDP sits at around $621 billion.
These states, each with their own industries, natural strengths, and cultural richness, form the backbone of the US economy. However, their large size and rapid growth also present unique challenges. Notable of these are high costs of living, resource management, infrastructure demands, and social disparities.

Michigan is home to the US’s only floating post office, the J.W. Westcott II. The J.W. Westcott Co. has been delivering mail to ships in the Port of Detroit since 1874.
©iStock.com/Paige Colman
Determining the Largest States: Key Metrics
The main factors we used to measure state size are (1) population size, and (2) GDP. Population size is often seen as a straightforward indicator of a state’s size. GDP, on the other hand, measures the total value of goods produced and services provided in a state over a specific period, reflecting the state’s economic output and strength. These metrics provide a broad understanding of a state’s size in terms of its inhabitants and economic contributions.
Key Factors in Future State Projections
Projecting the largest states in the future is a complex task. It requires an understanding of various demographic, economic, and socio-political factors. Below are the essential factors that come into play when making these educated guesses:
1. Demographic Trends
Age distribution, birth rates, and death rates within a state significantly influence its population growth. States with younger populations and higher birth rates are likely to see faster population growth. Conversely, states with older populations and lower birth rates may experience slower growth or even population decline.
2. Migration Patterns
Both internal and international migration patterns affect a state’s population size. States that are attractive to migrants, due to factors such as job opportunities, quality of life, and favorable immigration policies, are likely to see population increases.
3. Economic Factors
The strength of a state’s economy can greatly influence its population growth. States with robust economies that provide ample job opportunities and high living standards can attract more residents.
4. Policy and Legislation
Government policies and legislation at both the state and federal levels can impact population growth. Policies relating to immigration, housing, taxation, and social services can make a state attractive to potential residents.
5. Environmental Factors
Climate and geography can also influence a state’s attractiveness. States with favorable climates and attractive natural features may experience population growth. States prone to natural disasters or severe climate conditions may see slower growth or even population decline.
6. Education and Healthcare
The quality and accessibility of education and healthcare services in a state can impact population growth. Such factors may contribute to moving decisions, especially for families with small children.
7. Technological Advancements
Technological advancements can lead to job creation, improve quality of life, and attract residents to a state. They can also influence the economic growth of a state, thus affecting its ranking among the largest states.
8. Social Factors
Social dynamics such as cultural diversity, inclusivity, crime rates, and community engagement can also influence people’s choice of residence.
These factors, along with other unforeseen events, contribute to the complexity of projecting the largest states in the future. It’s important to remember that projections are based on current and historical data and trends, and the future may unfold differently because, well, it’s the future.
The Fastest Growing States Today
The rate of growth is an essential factor when considering the largest states, both now and in the future. Some of the fastest-growing states in the US (from 2010 to 2023) are situated across the country, with the notable exception of the eastern third of the nation. These include Utah, Idaho, Texas, North Dakota, Nevada, Colorado, Washington, Florida, Arizona, and South Dakota.
Salty Utah leads the pack, with a total growth of 23.88% during this period. These states have seen significant population increases, with new residents attracted by several factors, such as job opportunities, favorable business environments, and quality of life. Their fast growth also brings unique challenges in terms of infrastructure needs, resource allocation, and social services. Especially significant are the challenges surrounding water shortages, as the area is prone to severe drought, such as the one that lasted from June 2020 until the end of March of this year.

We can get an idea of what the next 50 years will look like, but it’s probably best to expect the unexpected.
©Ground Picture/Shutterstock.com
The Largest States in 50 Years
According to the Congressional Budget Office (CBO), if current laws remain unchanged, federal debt held by the public would reach a whopping 202% of GDP by 2051. The primary deficit, which excludes interest payments on the federal debt, would increase from 3 percent of GDP in 2021 to 8.6 percent in 2051. The aging of the population and the rising cost of healthcare contribute significantly to the projected increase in spending for major benefit programs. This is the national economic context for our projections.
For demographics, the Pew Research Center projects that the US population grow from 296 million (back in 2005) to 438 million in 2050. This represents a 50% increase. Population growth will be slower for non-Hispanic whites than for other races and ethnicities. Whites will become a minority (47%) by 2050. The Hispanic population will triple in size by then, accounting for most of the growth.
These projected demographic and economic changes, along with a state’s ability to adapt to them, play a significant role in determining the fastest-growing states.
Projections for the year 2073 suggest that the 10 states likely to be the largest in 50 years are as follows:
1. California
California is projected to remain the most populous state, despite its slow growth rate. Its robust economy, diverse culture, and attractive climate continue to attract people from all over the country and the world. The tech industry in Silicon Valley and the entertainment industry in Los Angeles are significant contributors to the state’s economy and population growth.
2. Texas
Texas should see significant growth due to its strong economy and low cost of living. The energy sector, including oil, gas, and increasingly renewable energy, along with the tech industry in cities like Austin, is expected to drive this growth.
3. Florida
Projected population growth in Florida is significant, fueled by a high rate of retiree migration and an expanding Hispanic population. The state’s warm climate, popular beaches, and no state income tax make it an attractive destination for retirees and immigrants.
4. New York
Despite its slower growth rate when compared to some states, New York will likely uphold its status as one of the most populous states, courtesy of its economic opportunities and cultural attractions. New York City, as a global hub for finance, arts, and culture, continues to attract a diverse population.
5. Pennsylvania
Pennsylvania’s population is projected to grow moderately, driven by its diverse economy and high quality of life. The state’s strongest sectors are manufacturing, healthcare, and education. Thus it safely promises stable employment opportunities for potential residents.
6. Illinois
Although Illinois faces current trends of population decline, its strong economy, particularly within the Chicago metropolitan area, will likely uphold its status as one of the largest states. The city’s finance, healthcare, and technology sectors are poised to play a crucial role in maintaining population stability.
7. Ohio
Ohio anticipates steady growth, underpinned by its diverse economy and high quality of life. The robust manufacturing sector statewide, coupled with burgeoning tech and healthcare industries in cities like Columbus and Cincinnati, stands to foster this growth.
8. Georgia
Georgia’s population is projected to grow significantly due to its strong economy, particularly in the Atlanta metropolitan area. Another population growth driver is its attractive climate. The state’s thriving sectors include logistics, film, and information technology.
9. North Carolina
North Carolina is expected to see substantial growth due to its strong economy, quality of education, and attractive living conditions. The state’s Research Triangle Park (Raleigh-Durham-Chapel Hill), a major center for high-tech and biotech research, is a significant driver of this growth.
10. Michigan
Michigan is set to experience moderate population growth, propelled by its rejuvenating economy and the allure of its Great Lakes region. The state’s automotive industry and emerging sectors like healthcare and technology stand ready to boost this growth.
These projections are based on current trends and assumptions. Actual outcomes may vary because of unforeseen circumstances or changes in migration patterns, birth rates, death rates, and other demographic factors. Factors such as climate change, economic shifts, and policy changes can also significantly impact these projections.

Global warming is accelerating climate change sooner than predicted. We will likely need to accelerate our response to the climate crisis, to avoid the worst outcomes.
©BaLL LunLa/Shutterstock.com
Main Implications of Population Shifts
Demographic changes or changes in the composition of a population can have far-reaching implications across various sectors of society. The impacts of these shifts are often complex and interconnected, affecting everything from the economy to public services, the political landscape, the social fabric, the environment, education, and healthcare. The following sections delve into the main implications of these demographic shifts. Understanding these implications is crucial for policymakers and stakeholders to anticipate changes and plan effectively for the future.
Economic Impact
The demographic shifts are leading to economic impacts such as labor shortages and increased training and education expenses. For example, as older workers retire, businesses must hire newer, sometimes inexperienced, workers to fill vacant spots. This can lead to increased training costs and potential operational inefficiencies. Smaller family sizes or delaying a family altogether can lead to a shortage of younger replacement workers. And even when people start to have families, the nation’s lack of affordable childcare prevents one parent from working.
Public Services
Like the overall workforce, demographic changes are affecting public services in several ways. For example, there is a shortage of state and city personnel, especially those who must work on-site. This has led to unions helping to get people in the door. Additionally, changing demographics are affecting the ability of states to collect revenues.
Healthcare
The rising demand for healthcare services, especially in chronic disease management and geriatric care, is likely to stem from the growing aging population. This could strain healthcare resources and necessitate changes in healthcare delivery, such as increased use of telemedicine and home healthcare. The growing diversity of the population could also require healthcare providers to adapt their practices to accommodate diverse cultural values and beliefs. Furthermore, the increase in health issues related to lifestyle, such as obesity, heart disease, and diabetes, could further increase the demand for healthcare services. To meet these challenges, healthcare providers are forming partnerships with companies that can provide innovative solutions for disease management and healthcare delivery.
Environment
Demographic changes can have profound impacts on the environment. Rapid urbanization and population growth will likely lead to increased demand for natural resources, higher energy consumption, and greater waste generation. These are all big contributors to environmental degradation and climate change. On the other hand, aging populations in some countries could lead to decreased demand for resources and energy, potentially reducing environmental pressures. However, the environmental impact of demographic shifts also depends on factors such as consumption patterns, technological advancements, and environmental policies. For example, the Texas blizzard of February 2021 caused rolling blackouts across the state.
Social Impact
Demographic changes are leading to social impacts, such as changes in the composition of the police force. For instance, the Chicago Police Department is now younger, less White, and more Latino. Moreover, a significant number of Black officers have left the department. Also, the representation of Asian police officers is disproportionately low, being approximately 50% less than what their proportion in the city’s overall Asian population would suggest.
Political Landscape
The shift towards a more diverse and aging population is set to generate substantial political implications. The increasing diversity could lead to shifts in political ideologies and party affiliations, with potentially more liberal views on immigration, racial and ethnic equality, and social policies. The aging population could lead to increased focus on policies related to healthcare, social security, and retirement. Yet, factors like varying voter turnout rates among different demographic groups and the political engagement of younger generations could temper the political impact of these demographic shifts.
Conclusion
The United States, a vibrant and evolving nation, will undoubtedly see significant changes in the demographic and economic landscape over the next 50 years. As we imagine a more crowded future, it’s crucial to understand and prepare for all these changes. The states that can adapt to and capitalize on the upcoming challenges will be the ones to watch. While crystal balls are often mirrors to the past, they can still shed some light on the future in the form of trends. And the states discussed here are trending big and mighty.
Summary of the Largest States in the United States Now
| Rank | State | Population | GDP |
|---|---|---|---|
| 1. | California | 39 million | $3.6 trillion |
| 2. | Texas | 30 million | $2.1 trillion |
| 3. | Florida | 22 million | $1.4 trillion |
| 4. | New York | 20 million | $2 trillion |
| 5. | Pennsylvania | 13 million | $923 billion |
| 6. | Illinois | 12.5 million | $1 trillion |
| 7. | Ohio | 11.7 million | $823 billion |
| 8. | Georgia | 11 million | $756 billion |
| 9. | North Carolina | 10.6 million | $730 billion |
| 10. | Michigan | 10 million | $621 billion |
Summary of the Largest States in the United States in 50 Years
| Rank | Largest States in the Year 2073 |
|---|---|
| 1. | California (rank unchanged from 2023) |
| 2. | Texas (rank unchanged from 2023) |
| 3. | Florida (rank unchanged from 2023) |
| 4. | New York (rank unchanged from 2023) |
| 5. | Pennsylvania (rank unchanged from 2023) |
| 6. | Illinois (rank unchanged from 2023) |
| 7. | Ohio (rank unchanged from 2023) |
| 8. | Georgia (rank unchanged from 2023) |
| 9. | North Carolina (rank unchanged from 2023) |
| 10. | Michigan (rank unchanged from 2023) |


How to Add Us to Google News


Thank you for reading! Have some feedback for us? Contact the AZ Animals editorial team.