
Quick Take
- The math behind counting America's fish catches sounds simple, yet the hidden complexity is exactly why your local fishing records might be less accurate than you think. See the hidden complexity →
- Over 25 programs feed data into one national system, yet no single survey method works everywhere. Understanding why reveals how differently your state's fishing records are tracked compared to others. Explore the partner network →
- When fishing survey methods change, old and new records can become incompatible, and the solution scientists use to fix this is not what most people would guess. See how calibration works →
- The catch data anglers casually report at the dock directly shapes federal quotas, yet most fishermen have no idea how much weight their story actually carries. Explore how catch shapes quotas →
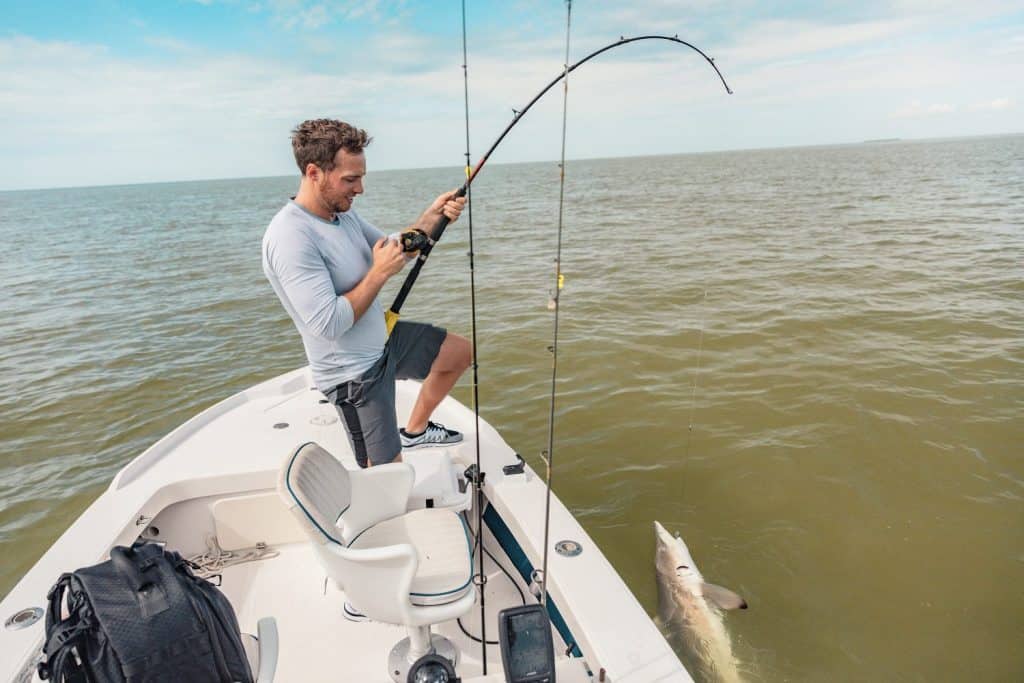
Throughout the United States, what anglers catch isn’t just exciting for sport, it’s also critical for science. Behind every fish story, there’s a network of data collection efforts quietly tracking what’s pulled from American waters. This network, driven by NOAA Fisheries and its partners, is at the heart of how the nation tracks record catches and the health of marine fish stocks.
Continue reading
How a National Partnership Tracks Every Catch
NOAA Fisheries doesn’t work alone. Its Marine Recreational Information Program (MRIP) joins state, regional, and federal partners in gathering data from coast to coast. Together, they manage a complex system of surveys designed to estimate the total recreational catch in U.S. waters. With the coming transition to a new data enterprise, announced as the Recreational Angler Partnership Improvement Directive, NOAA aims to strengthen both trust and accuracy in these vital statistics. The new system, supported by commissions and state agencies, is poised to launch with workshops starting in 2026.
©Maridav/Shutterstock.com
This collaborative approach allows regional differences to thrive. Each community’s unique fisheries and methods shape local survey strategies, what works on the Atlantic coast looks different than what’s needed in Hawaii or the Gulf. In total, over 25 programs feed data into the national effort, with central oversight and quality checks at NOAA’s Office of Science and Technology.
Gathering Data, One Angler at a Time
Survey teams rely on a mix of tools to capture a representative view of American saltwater fishing. In-person interviews at marinas and beaches, telephone and mail surveys, and digital reporting all contribute. Rather than counting every single catch, an impossible task, experts expand data from samples to estimate the full scope of recreational fishing activity.
The calculation is deceptively simple at its core: multiply the catch rate (average fish per trip) by the total number of trips in a given time period. But behind this are carefully weighted statistical techniques, ensuring samples reflect the diversity of fishing destinations and participants. Each step is shaped by lessons from rigorous testing and peer review, and standards align with agencies like the U.S. Census Bureau and National Center for Health Statistics.
Unique surveys target unique fisheries. The Access Point Angler Intercept Survey, Fishing Effort Survey, For-Hire Survey, and Large Pelagics Survey each serve specific roles, collecting everything from the number of fish landed to the number of trips taken. For scientists, these are the vital signs for fish populations, informing both assessment and management.
©Rocksweeper/Shutterstock.com
From Catch Totals to Conservation Decisions
Estimates drawn from MRIP feed directly into the work of fisheries managers. Combined with commercial catch figures, direct biological research, and real-time observation, these recreational statistics underpin decisions about quotas and rules designed to keep American fish stocks healthy over the long run.
Because survey methods evolve, methods for calibrating new data with historical records become critical. When a survey changes, calibration allows both old and new numbers to be spoken in the same “currency”, safeguarding continuous, comparable records that support long-term monitoring. There’s no universal calibration method, but the goal remains unchanged: maintain a single, reliable time series no matter how survey technology advances.
Certification is the benchmark of quality. Before new surveys contribute to fisheries management, they must meet rigorous standards and pass a peer review. Transition plans detail how new results will relate to previous estimates. All of this, combined with robust quality control, helps keep errors in check and data trustworthy.
A Constant Drive for Better Knowledge
Improving recreational fishing data never stops. Independent reviews, like those by the National Academies of Sciences, Engineering, and Medicine, have highlighted the progress made, especially in survey design and statistical rigor. NOAA Fisheries continues to invest in new research and updated standards, embracing technology without compromising consistency or comparability across regions.
The public is encouraged to put this data to use. An open-access query tool lets anglers, researchers, and managers explore statistics by location, species, time, and more. Publicly available datasets open the door to custom analyses, while regular updates ensure fresh insights.
Looking ahead, NOAA’s move toward a new partnership-driven framework marks another step in America’s commitment to understanding the world beneath the waves. Each improvement brings clarity not just for scientists or resource managers, but for anglers whose stories help tell the changing tale of the country’s fisheries.